



If most of us were asked which day of the week the office fills up the most, we’d probably think we had a pretty clear idea of the answer. But would that idea be right?
CBRE measures this every year in its Global Workplace & Occupancy Insights report. In the 2026 edition, 73% of the companies surveyed name Tuesday as their busiest day for office attendance. Wednesday trails well behind at 23%, and Thursday barely reaches 3%.
In that same survey, Monday shows up as the peak attendance day for exactly 0% of companies. But does this hold true across every country?
At Hybo we’ve been monitoring this for months, and we see very different results. But instead of asking companies what they think happens in their offices, we’ve measured what their workforces actually book each day. In Spain, the result points in exactly the opposite direction.
The data doesn’t lie
Between January and July 2026, Spanish companies using our platform logged 735,100 bookings of shared resources. These bookings are split across parking spaces, office workstations, canteen, and meeting rooms. The data comes from 47 companies headquartered in Spain.
Here’s the breakdown by day of the week.
| Day | Bookings | % of the week | Index (Monday = 100) |
|---|---|---|---|
| Monday | 217,500 | 29.6% | 100 |
| Tuesday | 163,100 | 22.2% | 75.0 |
| Wednesday | 139,400 | 19.0% | 64.1 |
| Thursday | 121,200 | 16.5% | 55.7 |
| Friday | 93,900 | 12.8% | 43.2 |
This data traces a steady downward trend, with each day logging fewer bookings than the one before, and the drop already starting from Tuesday onward. Along these lines, Monday accounts for 2.3 times the bookings of Friday, and Thursday already shows 44% fewer bookings than Monday.
What does this data tell us?
Anyone with a fixed parking spot or an assigned desk doesn’t book anything, so they don’t show up in this data. What the 735,100 records show is the pressure on shared resources, which is exactly where internal conflicts between employees arise.
There’s a Spanish cultural factor at play here, where intensive workdays and working from home on Fridays are widespread. Much of Friday’s drop-off is therefore structural.
What’s striking about this curve isn’t Friday. It’s Tuesday and Wednesday.
The Tuesday effect exists in Spain, but only for rooms
The contradiction with the global data collected by CBRE is real, but not 100%. When we break down the four types of resources, we find one exception:
| Resource | % of total | Mon | Tue | Wed | Thu | Fri |
|---|---|---|---|---|---|---|
| Parking | 55.0% | 100 | 67.8 | 57.1 | 53.3 | 37.2 |
| Desks | 31.9% | 100 | 82.2 | 73.0 | 56.6 | 52.5 |
| Canteen | 9.5% | 100 | 85.4 | 72.2 | 59.1 | 43.4 |
| Rooms | 3.0% | 100 | 125.5 | 93.6 | 93.6 | 68.1 |
When do employees meet the most?
The takeaway here is that people come to the office more on Monday, but meet more on Tuesday.
The day with the highest office attendance and the day of peak collaboration aren’t the same day. Confusing the two could lead to sizing the office incorrectly.
That said, this exception should be taken with caution, since room bookings only account for 3% of the total bookings captured in Hybo’s data.
Parking accounts for more than half of all bookings
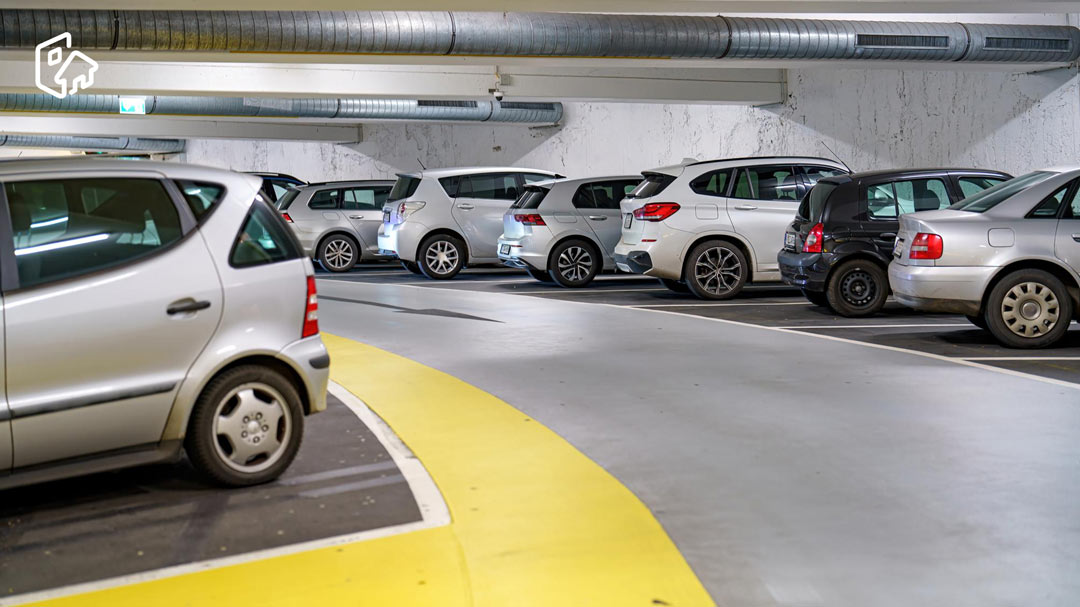
Out of Hybo’s own data, parking makes up 55% of all bookings made, and it’s also the most unevenly distributed of the four resources. Monday racks up 168% more parking bookings than Friday. For workstations, that same gap is only 90%.
Here’s how the 403,200 parking bookings logged between January and July 2026 break down across the week.
| Day | Parking bookings | % of the week | Index (Monday = 100) |
|---|---|---|---|
| Monday | 127,800 | 31.7% | 100 |
| Tuesday | 86,700 | 21.5% | 67.8 |
| Wednesday | 73,000 | 18.1% | 57.1 |
| Thursday | 68,100 | 16.9% | 53.3 |
| Friday | 47,600 | 11.8% | 37.2 |
| Total | 403,200 | 100% | — |
How much of a priority is parking when choosing a building?
The same study details how employees get to work. While 69.4% use public transport to reach the office, 22.2% drive their own car, and 8.3% use a company vehicle. On top of that, 75% spend between half an hour and an hour on their round-trip commute.
Looking jointly at parking and workstation booking data, we see that Monday kicks off the week with peak office attendance and frustration for many employees, since there aren’t enough parking spaces for everyone who requests one.
Why the week is distributed so unevenly
So far we’ve seen what happens with resource bookings in the office. But why is the distribution so uneven across the week?
The truth is it has little to do with Spanish work culture, or a desire to start the week strong. It has to do with how the booking system is typically configured.
Each office chooses how often its staff can book each resource — daily, weekly, or biweekly. Looking at the assignment methods of the companies analyzed by Hybo in this article, there are 336 different configurations (each company can have a different configuration for each of its offices).
| Resource | Daily | Weekly | Biweekly | Total |
|---|---|---|---|---|
| Parking | 125 | 15 | 6 | 146 |
| Desks | 135 | 0 | 3 | 138 |
| Canteen | 46 | 3 | 3 | 52 |
| Total | 306 | 18 | 12 | 336 |
Of those 336 assignment method configurations, 306 are set to daily mode — that’s 91%. Weekly booking was only chosen in 5.4% of configurations, and biweekly in 3.6%.
Workstations are the extreme case
It’s worth pausing to consider what this means, since weekly (or biweekly) booking is the format that would allow for better resource coordination. A weekly assignment method would require deciding in advance which days each team would come into the office, and that plan would be visible to everyone else.
Why does resource allocation need to be planned?
So rather than the declining booking curve being a natural feature of hybrid work in Spain, it looks like the predictable result of not applying any planning method at all.
Your policy says how many days. It doesn’t say which ones
This is where in-office attendance policies usually fail to capture the full picture of resource management. Let’s look at why.
According to the Savills and PwC study, the most common model in Spain combines 2 remote days with 3 office days. 36% of companies use this, while 17% use a formula of 1 remote day and 4 in-office days. Meanwhile, 22% of companies still keep all 5 days of the week in-office.
CBRE points in the same direction on a global scale. 96% of companies already have a defined attendance policy. The most common is three or more days, which has risen from 53% in 2024 to 66% today.
However, none of these policies specify which days to come into the office.
The difference between days per person and people per day
The first one, you made, and it’s spelled out in your attendance policy. The second one is made by the sum of your staff’s individual choices, every Sunday night.
The office is sized for sharing, and sharing requires spreading out
This is where the resource-booking curve turns into a cost problem.
CBRE puts the global occupancy ratio at 111%. In other words, more people are assigned to offices than there are physical desks available. This isn’t a calculation error — it’s a deliberate decision.
48% of companies are now targeting a ratio of between 1.01 and 1.49 people per desk. In 2024, only 21% did.
The condition that isn’t being met
The two figures CBRE publishes for 2026 describe exactly this tension. Average office utilization is 53%, the highest since before March 2020. Peak-hour utilization, on the other hand, reaches 80%.
This is the first time since the pandemic that this peak has exceeded the 65% target most companies set for themselves. The average says there’s room to spare, and the peak says there isn’t enough. Both are true, and they describe different days.
How this situation affects your company

For staff
The complaints concentrate on the one day when everyone is competing for resources, and «competing» is the exact right word. A parking spot, a desk near the team, a free meeting room mid-morning, a spot in the canteen at the right time. The other four days, that friction simply doesn’t exist.
The reason people go into the office actually makes the problem worse rather than better. According to Savills and PwC, people mainly go in to collaborate with their teams (18%) and hold in-person meetings (17.4%). Next come socializing (13.8%) and hosting visitors or clients (13.6%).
Going in to focus and concentrate is a minority reason, at 7.8%. People go to the office to be together, and being together with zero planning is exactly what overloads the building.
For the square meters you’re paying for
According to MVGM, in the second quarter of 2026 the average office rent in Madrid’s financial district reached €41.4/m² per month. In Barcelona it stood at €31.4/m², up 12.4% quarter-on-quarter compared to 3.7% in Madrid. In the city-center segment, prices have also risen, averaging €26.91/m² per month in Madrid and €19.95/m² in Barcelona.
Moving isn’t easy right now either. Savills and PwC put the office vacancy rate in Madrid at 8.68%, the lowest level since 2008. Within the M-30 ring, barely 2.60% of space remains available.
Against that backdrop, deciding how many square meters of office space to lease without a plan for how to distribute available resources across the week can get very expensive.
For parking spaces
Growth in the vehicle fleet is also putting pressure on this resource. According to the Asociación Española de Renting de Vehículos, the renting fleet closed the first half of 2026 with 1,063,492 vehicles in Spain. That’s 8.04% more than a year earlier.
85.83% of that fleet belongs to legal entities (companies). If you manage the company’s vehicle fleet, access control, or mobility plan, the problem isn’t how many cars there are. It’s that they all pile up on the same day, and that day is Monday.
Almost no company can measure its own curve
This whole conversation carries a blind spot. Most companies aren’t in a position to verify any of the above within their own building.
The Savills and PwC report measures the level of digitalization in the workplace and finds a striking contrast. Laptops, collaboration tools, and wifi are in place at 100% of companies. Room videoconferencing reaches 83%.
By contrast, desk and space booking apps are only at 44%. Building management apps reach 50%. Meanwhile, sensors that provide occupancy metrics only reach 17%.
Their conclusion, stated plainly, is that work itself is digitalized, but space and resource management is not.
The contrast with what corporate real estate teams are doing globally is notable. In CBRE’s data, the utilization rate is already the metric those teams track the most, at 83%. It’s also the one they consider the highest priority.
And 87% of companies set explicit targets to optimize building utilization. Measuring how resources are used has already become the global norm. Meanwhile in Spain, monitoring and optimizing resources is still the exception rather than the rule.
As a result, optimizing the distribution of something that isn’t being measured is difficult.
The decision that will make your life easier
Let’s go back to the question we started with, framed the right way. It’s not which day the office fills up, which is a descriptive question answered with a data point. It’s who decides which day it fills up.
Today, nine times out of ten, that decision makes itself. The sum of individual choices produces a packed Monday and an empty Friday. A result nobody actually decided, and one that appears in none of your company’s policies.
In an office with plenty of room, ample parking, and no complaints, this situation can carry on as is, since there are no points of friction.
But if there’s conflict over parking spaces or workstations, if you’re assessing how many square meters your office needs, or if you’ve been tasked with your company’s mobility plan, things change.
In that case, having software that lets you measure and optimize your available resources is what will make your life easier.